The Expense Report feature in Ever Accounting provides a detailed overview of your business expenses. It allows you to analyze expense trends, understand average expenditures, and view categorized expense details. Here’s a step-by-step guide to using the Expense Report.
How to Access the Expense Report
- Navigate to the Reports Section: Go to the WP Ever Accounting dashboard. Select Reports from the main menu.
- Choose the Expense Report: Under the Reports section, click on Expense. The Expense Report dashboard will load and display key metrics and visual data.
Expense Report Features
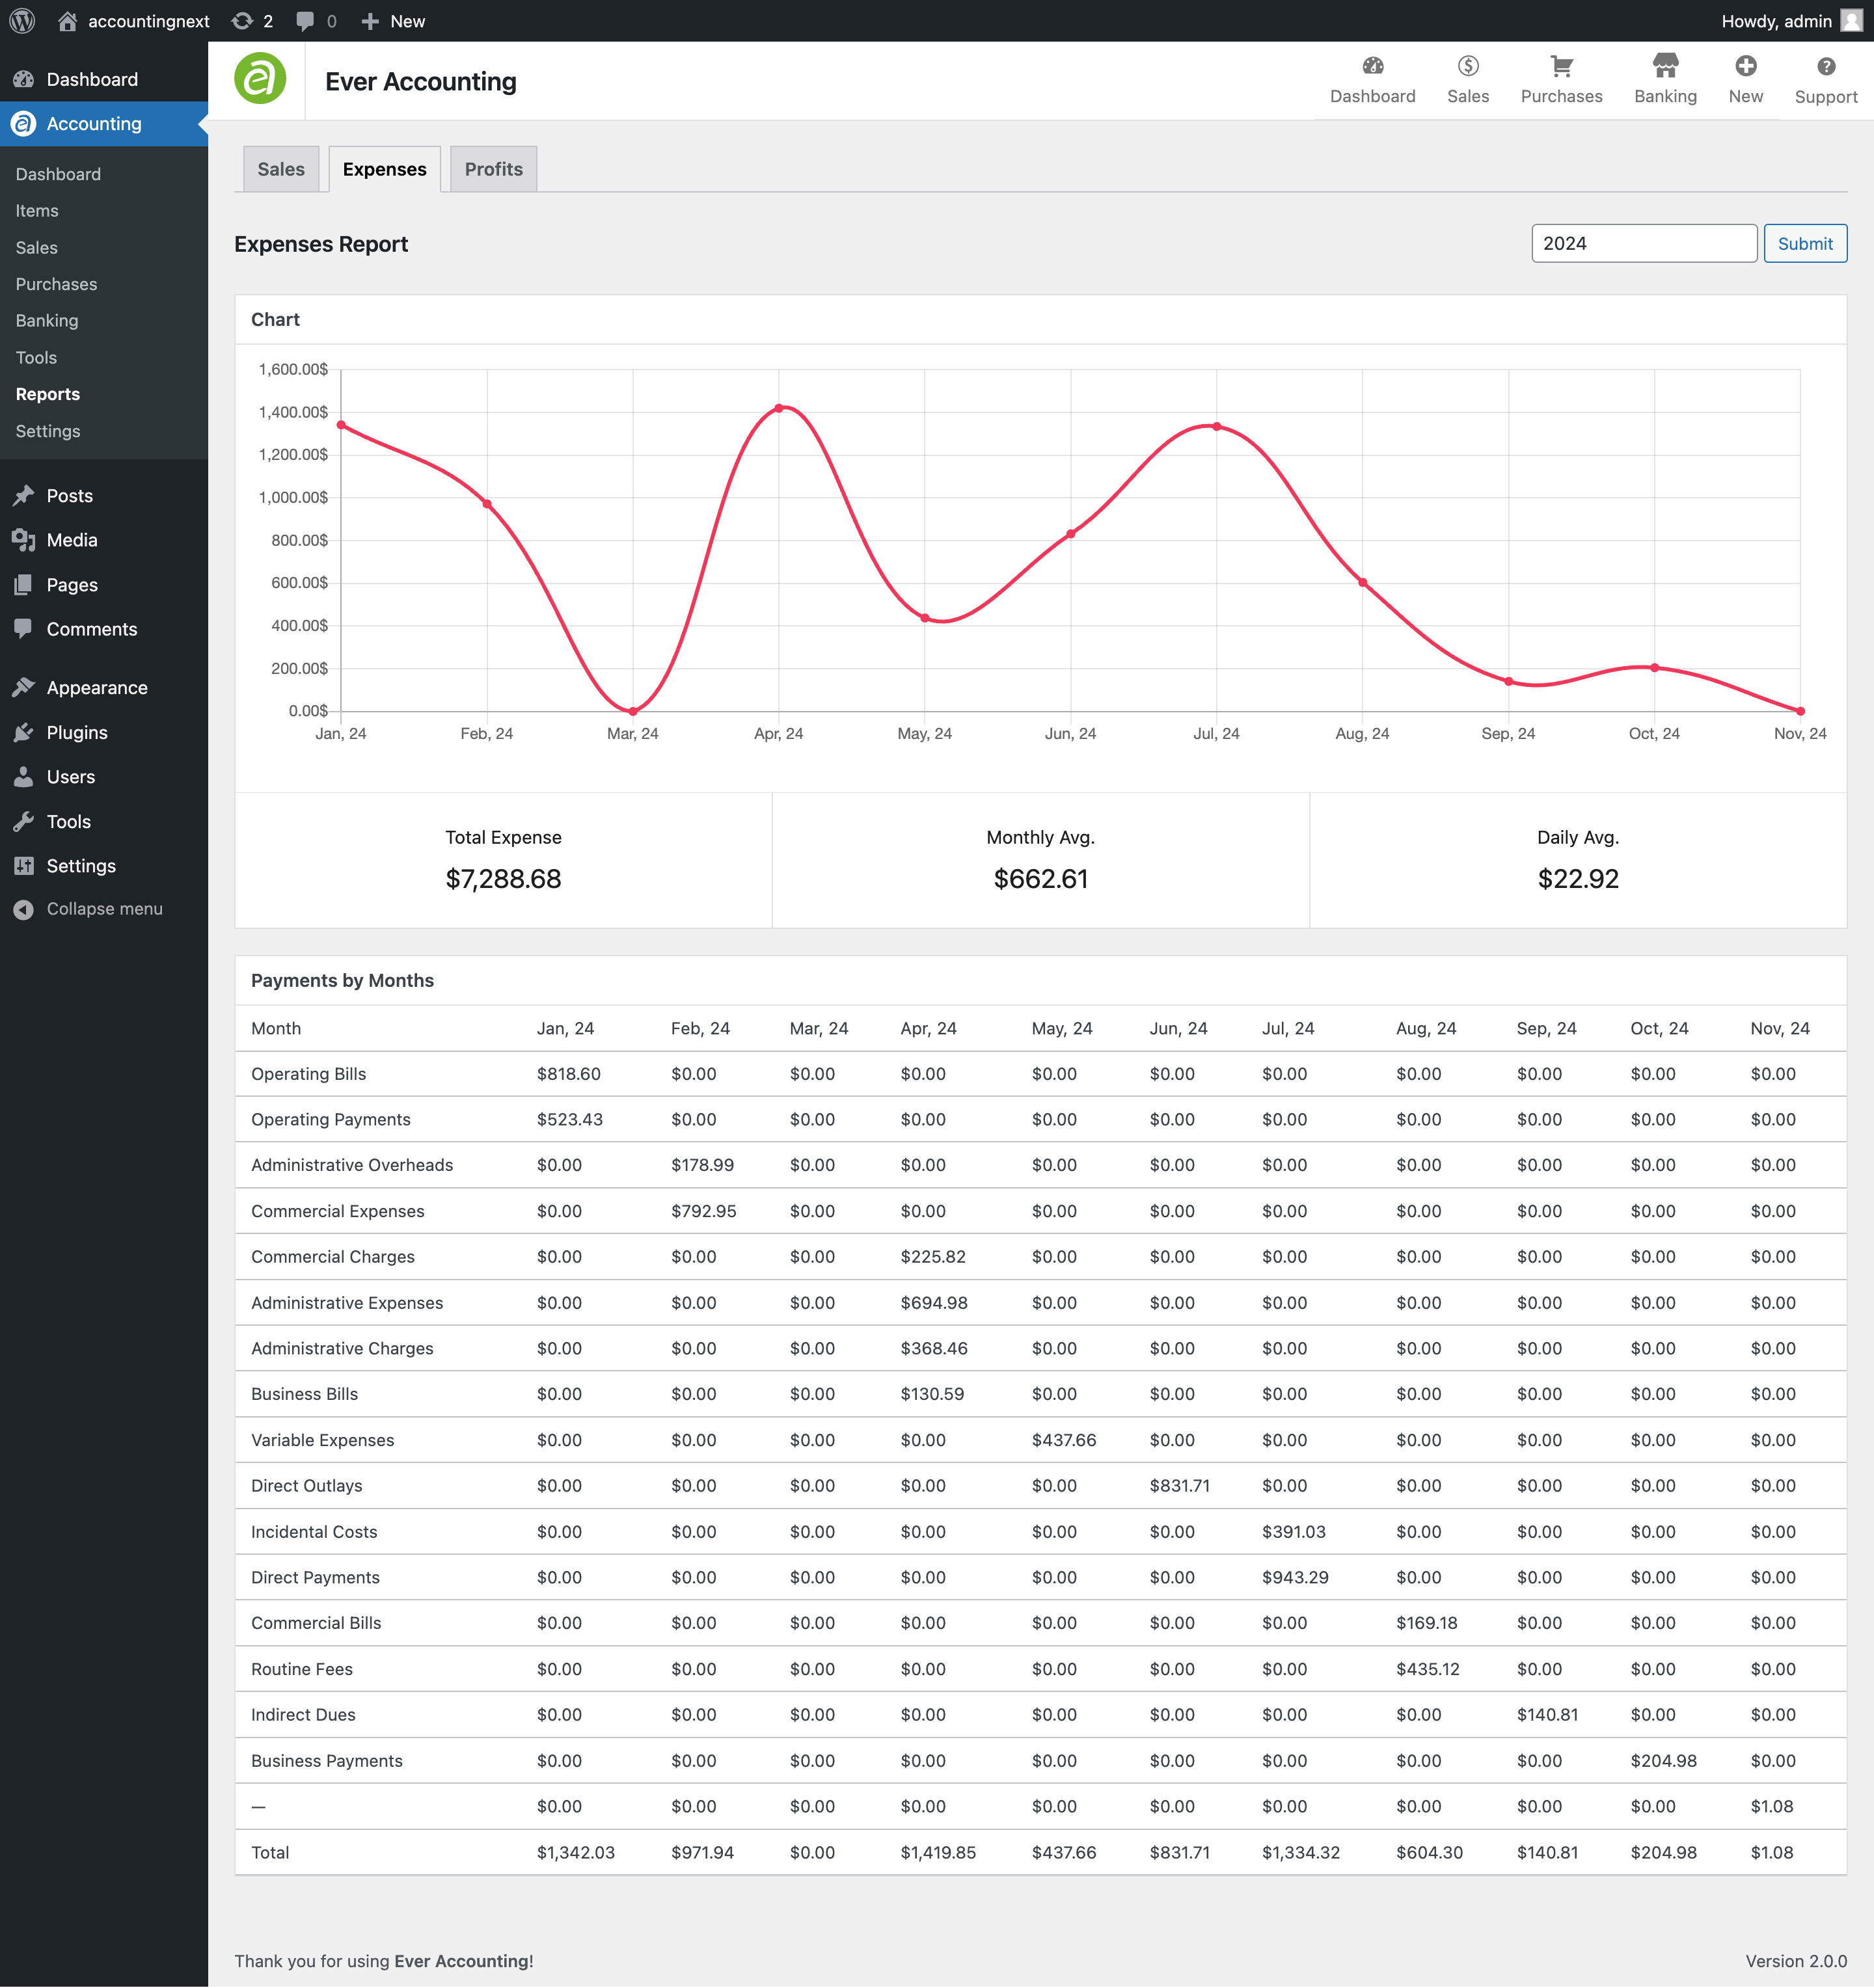
Chart Visualization
- A graphical chart displays expense trends over time.
- The chart helps identify periods with higher or lower expenses.
Key Metrics
- Total Expense: The cumulative amount of expenses for the selected year.
- Monthly Average: The average amount spent per month.
- Daily Average: The average daily expenditure.
Payments by Month Table
- This table categorizes expenses by month and type.
- Each row provides a breakdown of expenses.
- Each column represents the expense data for a specific month.
Select Year
The report updates dynamically based on the selected year.
Use the Select Year Option and Submit button to view expenses for a specific year.
Each of the sections shows graphs that are effective for displaying and summarizing financial data. Below the graph, each section yields categorical reports on a monthly basis.