The Sales Report feature in Ever Accounting offers a comprehensive overview of your business’s sales performance. With this tool, you can analyze total sales, identify trends, and review detailed monthly breakdowns to make data-driven decisions for your business.
How to Access the Sales Report
Follow these steps to access the Sales Report in WP Ever Accounting:
- Navigate to the Reports Section: Log in to your Ever Accounting dashboard. Select Reports from the main menu.
- Choose the Sales Report: Under the Reports section, select Sales. The Sales Report Dashboard will appear, displaying key metrics and visualizations.
Key Features of the Sales Report
The Sales Report section provides a variety of tools to help you analyze your sales data effectively:
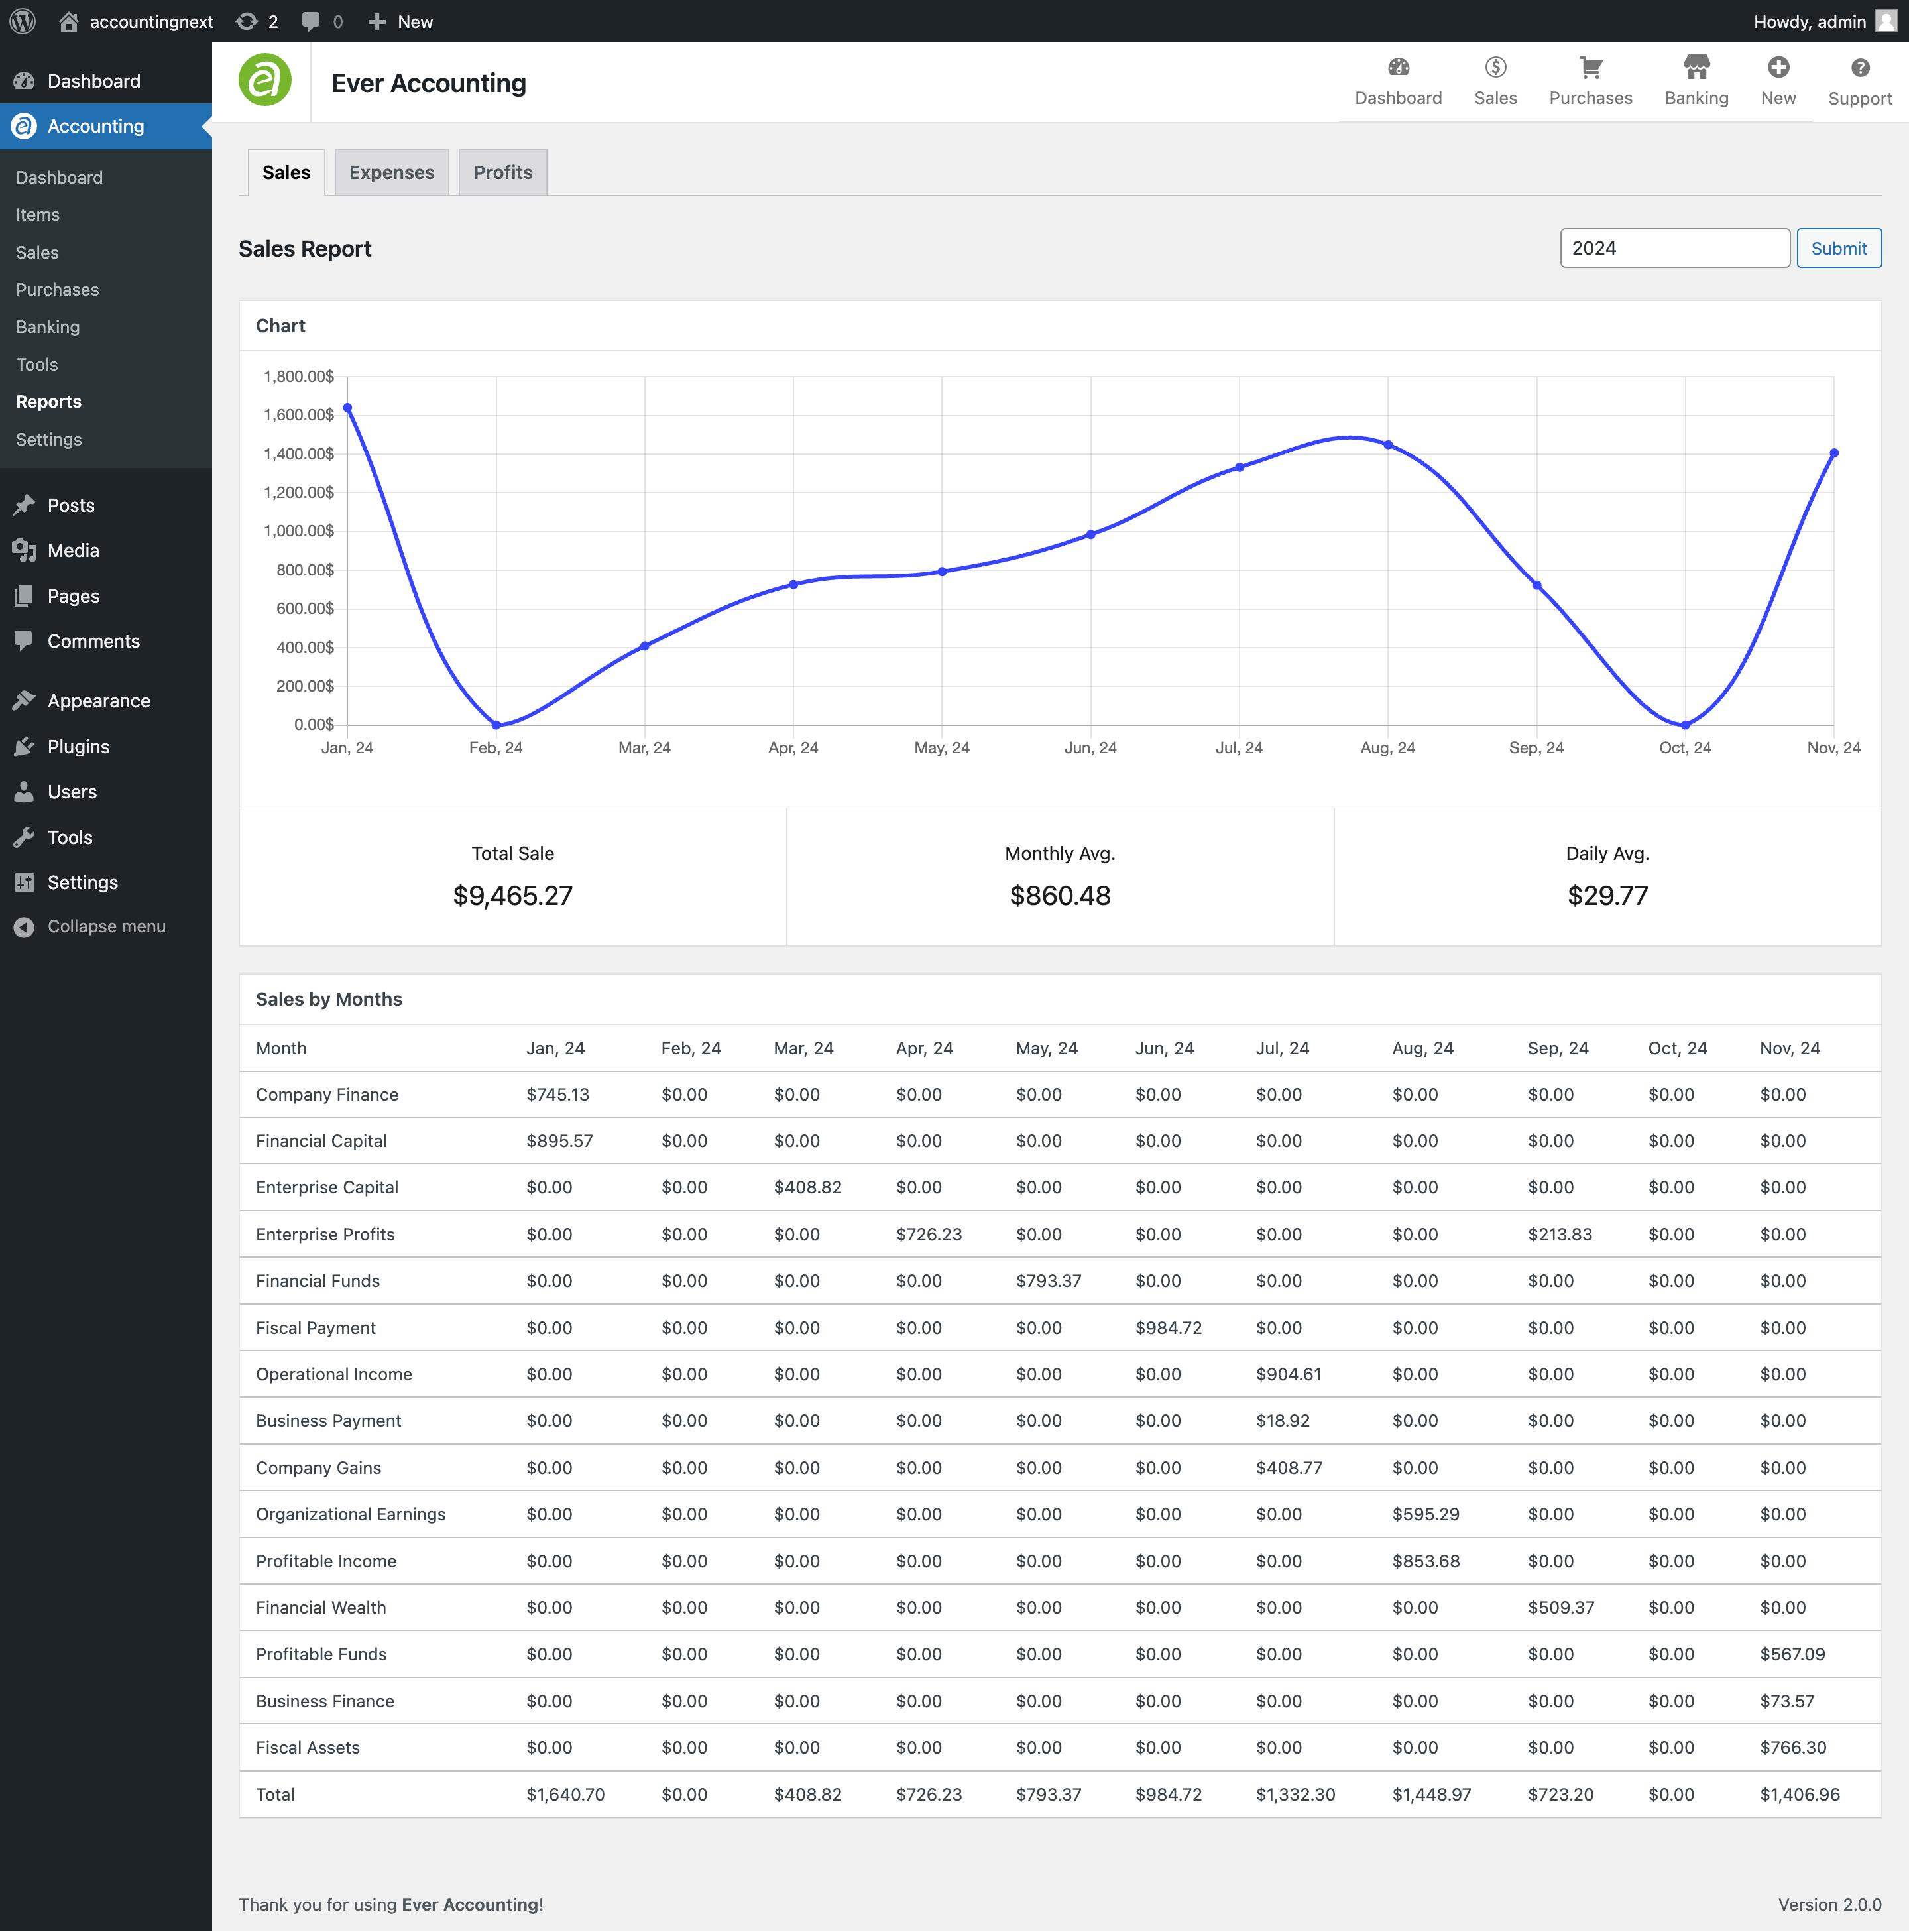
Chart Visualization
- A graphical representation of your sales data over time.
- Highlights monthly sales trends, making it easy to visualize growth or fluctuations.
Key Metrics
- Total Sales: Displays the cumulative sales amount for the selected year.
- Monthly Average: This shows the average monthly sales amount, helping you identify consistent performance or seasonal spikes.
- Daily Average: Calculates the average daily sales amount for the selected year.
Sales by Month Table
- Provides a detailed breakdown of sales by month.
- Each column represents the sales data for a specific month, allowing for quick comparisons of trends and categories.
Select Year
- Allows you to view sales data for a specific year.
- Use the Year Select option and click the Submit button to update the report dynamically.
Each of the sections shows graphs that are effective for displaying and summarizing financial data. Below the graph, each section yields categorical reports on a monthly basis.