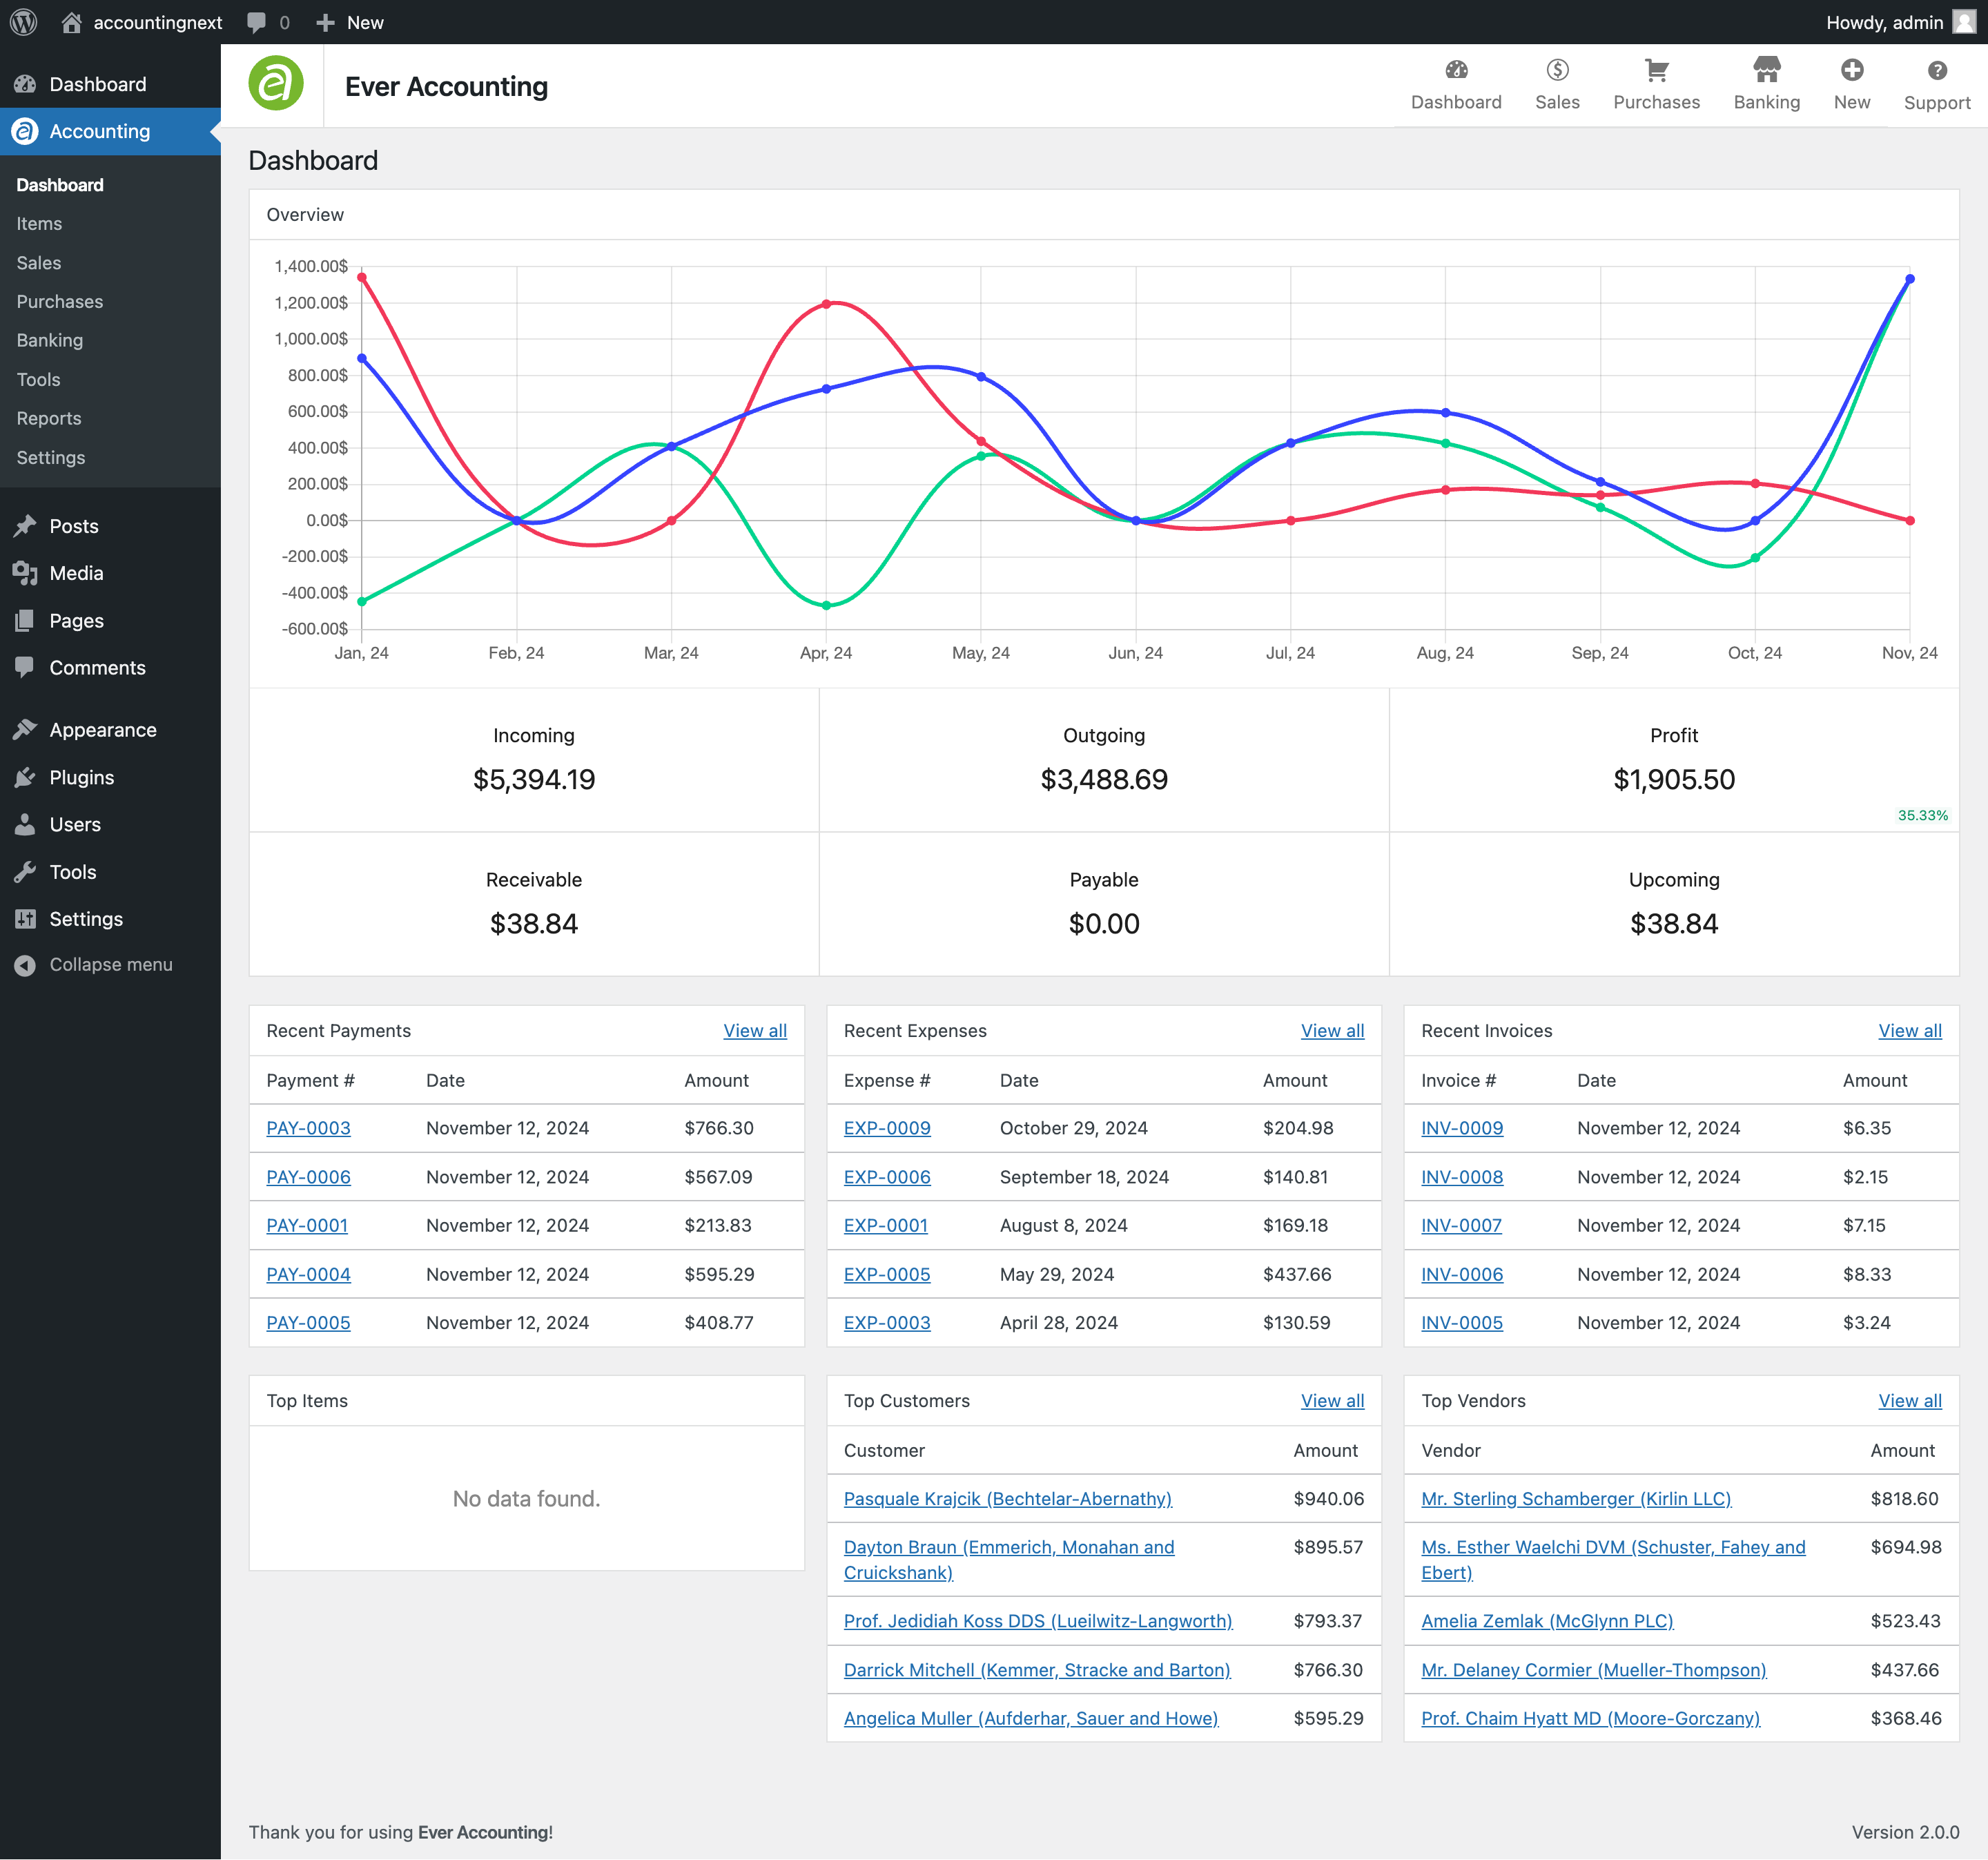
The Dashboard in Ever Accounting serves as the central hub for monitoring your financial data and gaining insights into your business’s financial health. This interactive page provides an at-a-glance summary of key metrics, recent activities, and top-performing entities. Below is a detailed breakdown of each section of the dashboard.
Overview Section
The Overview section is located at the top of the dashboard and provides a visual representation of your financial data over time. It includes a graph and key performance metrics.
Graph
- The graph visualizes your financial trends, including:
- Incoming: Total income over time.
- Outgoing: Total expenses or payments over time.
- Profit: The difference between income and expenses.
- The graph is segmented by months, offering a clear picture of financial growth or decline.
Key Metrics
- Incoming: Displays the total income received.
- Outgoing: Shows the total expenses or payments made.
- Profit: Calculates the net profit (Income – Expenses).
- Receivable: The total amount still owed by customers.
- Payable: The total amount your business owes to vendors or suppliers.
- Upcoming: Highlights upcoming receivables.
Recent Payments
This section displays a summary of the latest payments received.
- Payment #: Unique identifier for the payment.
- Date: Date the payment was received.
- Amount: Amount of the payment.
- View All: Click this link to see the complete list of payments.
Recent Expenses
This section lists the most recent expenses incurred.
- Expense #: Unique identifier for the expense.
- Date: Date the expense was recorded.
- Amount: Total expense amount.
- View All: Click this link to see the full list of expenses.
Recent Invoices
This section provides details of the latest invoices issued.
- Invoice #: Unique identifier for the invoice.
- Date: Date the invoice was issued.
- Amount: Invoice total.
- View All: Click this link to access the complete list of invoices.
Top Items
The Top Items section highlights the best-selling products or services.
- Item: Name of the product or service.
- Total Sales: Total revenue generated by the item.
Top Customers
This section lists your most valuable customers based on the total amount they’ve spent.
- Customer: Name of the customer.
- Amount: Total amount spent by the customer.
Top Vendors
The Top Vendors section highlights your key suppliers based on their total payments.
- Vendor: Name of the vendor.
- Amount: Total amount paid to the vendor.
How to Use the Dashboard Effectively
- Monitor Trends: Use the graph to track financial trends over time and identify patterns in income, expenses, and profit.
- Review Key Metrics: Keep an eye on receivables and payables to manage cash flow effectively.
- Analyze Recent Activity: Check the Recent Payments, Expenses, and Invoices sections for up-to-date information on financial transactions.
- Identify Opportunities: Use the Top Items, Customers, and Vendors sections to identify best-performing products, loyal customers, and reliable suppliers.