The Profits Report in Ever Accounting provides a clear overview of your business’s financial performance by analyzing revenues, expenses, and net profits. It offers graphical and tabular insights to help you track and optimize profitability.
How to Access the Profits Report
- Go to the Reports Section: Go to your WP Ever Accounting dashboard. Navigate to the Reports menu.
- Select Profits Report: Click on the Profits Report option. The dashboard will display all relevant profit metrics and visualizations.
Profits Report Features
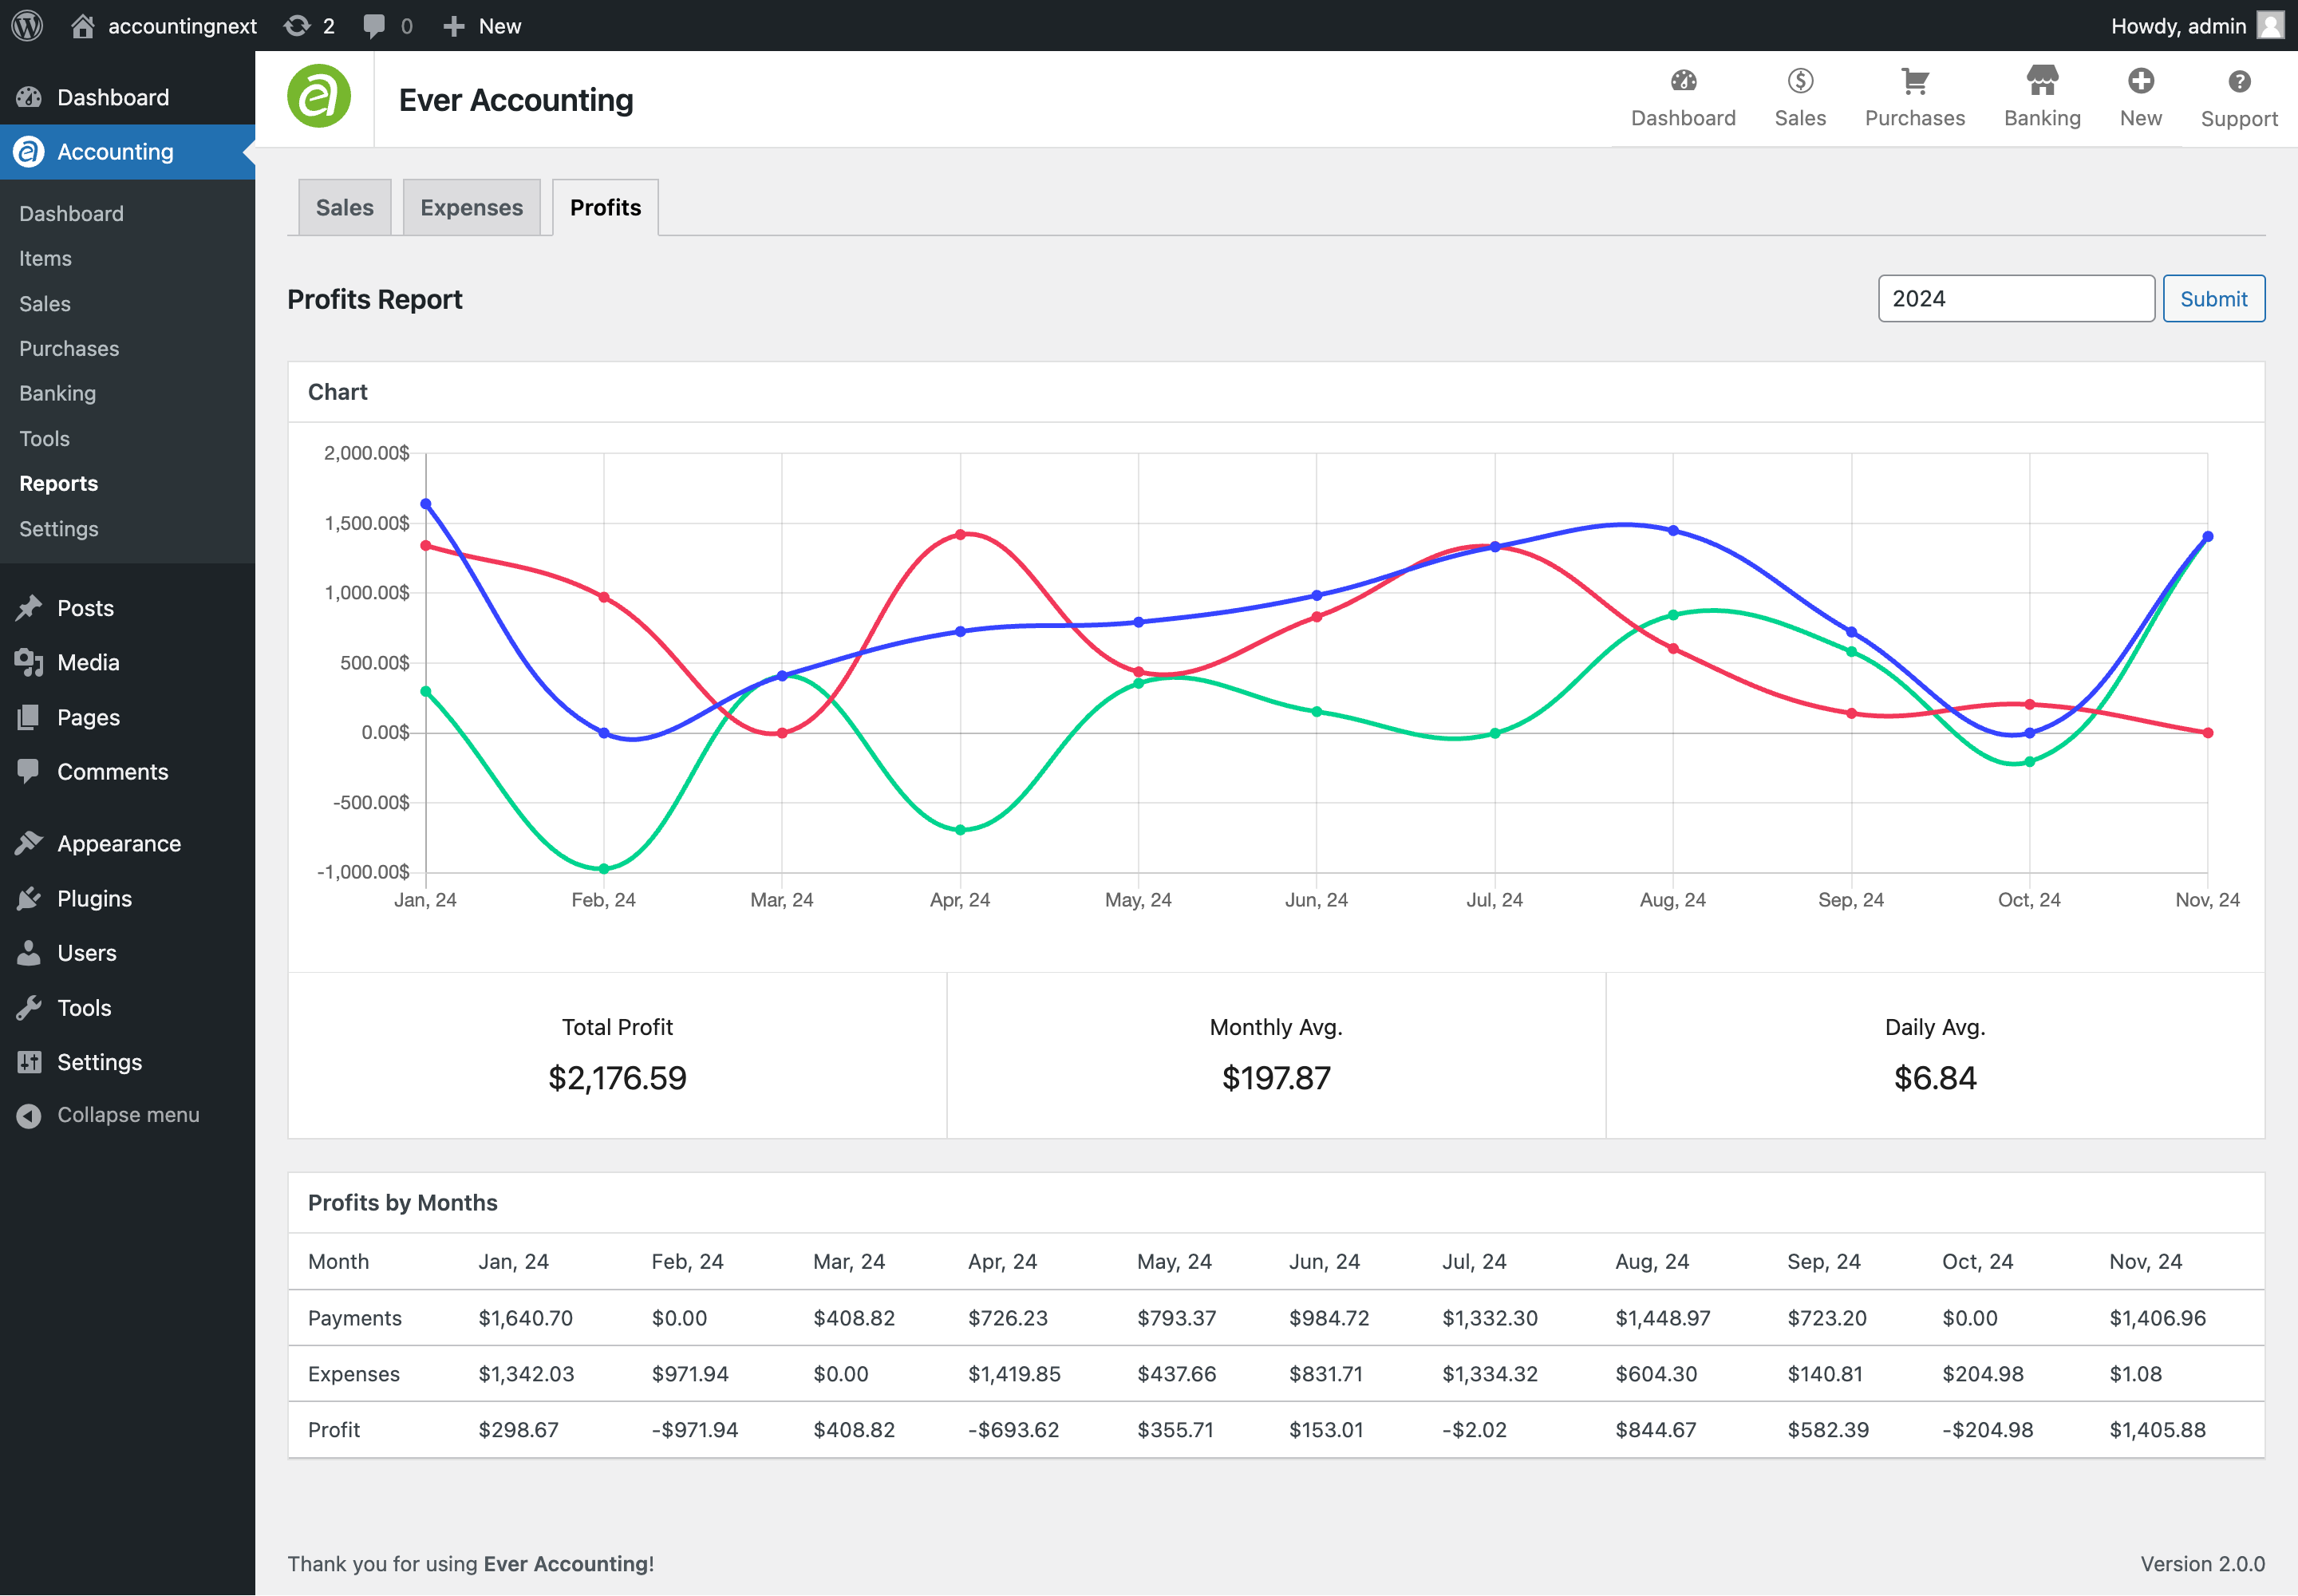
Graphical Chart
The chart visualizes the trends of Payments, Expenses, and Profits over time:
Blue Line: Represents total payments (income).
Green Line: Represents profits.
The chart allows you to easily compare revenue, expenses, and profits across months.
Key Metrics
- Total Profit: The net profit for the selected year.
- Monthly Average: The average profit earned per month.
- Daily Average: The average daily profit.
Profits by Months Table
- A detailed breakdown of financial data for each month, including:
Payments: Total revenue for the month.
Expenses: Total expenses for the month.
This section helps you identify specific months with high or low profitability.
Select Year
- Use the Select Year Option and Submit button to view profits for a specific year.
- The data updates dynamically based on the selected year.
Benefits of the Profits Report
- Actionable Data: Use monthly breakdowns to identify improvement areas or growth opportunities.
- Comprehensive Financial Overview: Track and analyze key profitability metrics.
- Visual Insights: Easily identify trends and outliers using the graphical chart.
Each of the sections shows graphs that are effective for displaying and summarizing financial data. Below the graph, each section yields categorical reports on a monthly basis.